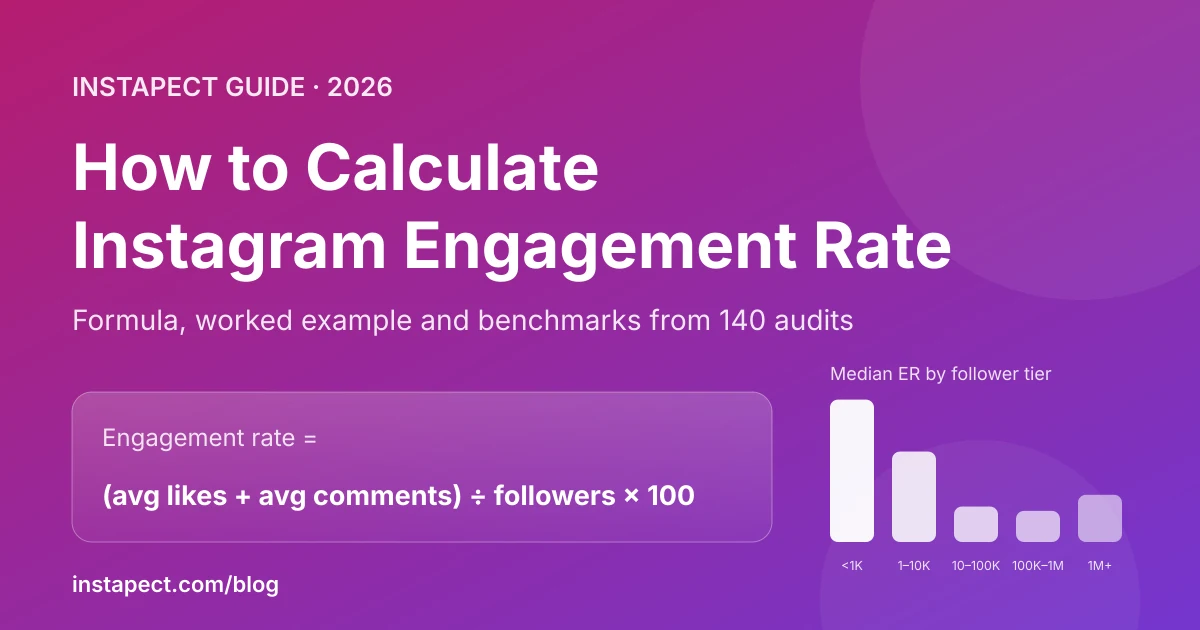
To calculate Instagram engagement rate, add the average likes and average comments of your recent posts, divide by your follower count, and multiply by 100. That takes about five minutes by hand. It also tells you very little until you know two more things: which version of the formula a benchmark used, and whether one viral post is inflating your average. In the 140 public-profile audits analysed for this guide, the average overstated the typical post by 25% or more on two out of three accounts.
This guide gives you the formula, a worked example, a spreadsheet you can paste into Google Sheets, a way to check your result, and benchmarks broken down by follower tier.
Disclosure: Instapect publishes this guide and makes one of the tools mentioned below. Every method here works without it.
Key takeaways
| Question | Short answer |
|---|---|
| Standard formula | (Average likes + average comments) ÷ followers × 100 |
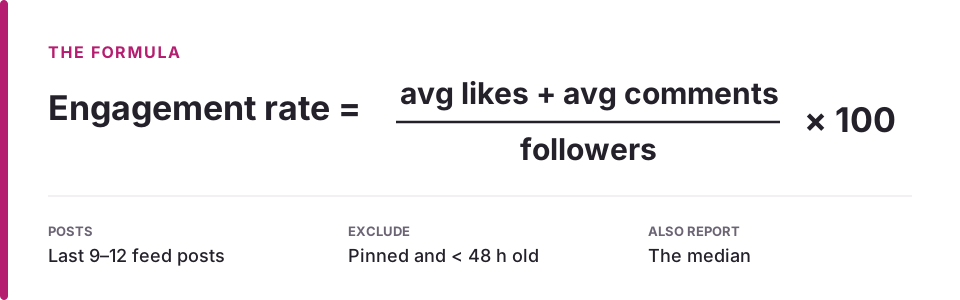
| How many posts to use | Your last 9 to 12 feed posts, excluding pinned posts and anything under 48 hours old |
| Report alongside it | The median engagement rate, which ignores one-off viral posts |
| Platform-wide average | 0.45% to 0.48% by followers (Socialinsider, 35M posts) |
| "Good" for a brand account | 1% or higher puts a brand in roughly the top 25% (Sprout Social, citing Rival IQ) |
| Biggest factor in what counts as good | Follower count. Median rates fall from about 15% under 1K followers to under 1% above 10K |
| Why calculators disagree | Different denominators (followers, reach, views) and different post samples |
What engagement rate actually measures
Engagement rate is the share of your audience that interacts with a typical post. It turns raw counts into something you can compare across accounts of different sizes. A post with 500 likes is a strong result for an account with 5,000 followers and a weak one for an account with 500,000.
Think of followers as the size of the room and engagement as the number of people who raised a hand. Engagement rate is the percentage of hands up. It does not tell you how many people walked past the door, which is what reach measures, and only the account owner can see reach.
That split matters because there are two families of formula:
- Public formulas use followers as the denominator. Anyone can calculate them for any public account, which is why brands vetting creators and marketers benchmarking competitors use them.
- Private formulas use reach, impressions or views as the denominator. They are more precise for your own account, but the numbers live in Instagram Insights and nobody else can check them.
The four engagement rate formulas compared
| Formula | Calculation | Who can calculate it | Typical range | Best for |
|---|---|---|---|---|
| By followers | (Likes + comments) ÷ followers × 100 | Anyone | 0.3% to 3% for most accounts | Comparing any two public accounts |
| By reach (ERR) | Interactions ÷ reach × 100 | Account owner only | Usually several times the follower-based rate | Judging how well a post landed with people who saw it |
| By views | Interactions ÷ video views × 100 | Account owner (views are partly public on Reels) | Varies widely by format | Reels performance |
| By impressions | Interactions ÷ impressions × 100 | Account owner only | Lower than ERR | Paid campaigns and repeat views |
According to Hootsuite, reach-based engagement rate is the best fit for judging your own feed posts and carousels, and views-based rate gives a steadier read on Reels. Socialinsider and Rival IQ both publish their benchmarks by followers, because that is the only version you can measure across hundreds of thousands of accounts.
This is the main reason benchmark figures disagree. Hootsuite's all-industry Instagram carousel benchmark is 4.2%, while Socialinsider's platform average is 0.48%, and Rival IQ's brand median is 0.36%. Socialinsider and Rival IQ state that they divide by followers; Hootsuite's article does not say which denominator its benchmark uses. A ninefold gap like that almost always comes from a different method, not a different reality, so check the denominator before you compare your number to any benchmark.
How to calculate Instagram engagement rate by followers (step by step)
Step 1: Pick the posts
Open the profile and take the last 9 to 12 feed posts. Then remove:
- Pinned posts. They can be months old and collect engagement for far longer than a normal post.
- Posts less than 48 hours old. They are still collecting likes and will pull your number down.
- Paid partnership posts with ad spend behind them, if you know about it. Boosted reach inflates interactions.
Twelve posts is a good balance. Fewer than six and a single post can swing the result. Many more than 12 and you are measuring how the account performed months ago.
Step 2: Record likes and comments for each post
Write down the like count and comment count for each post. If the account hides like counts (Instagram has allowed this since 2021, per Meta), you cannot calculate a public engagement rate for it. Skip the account rather than guessing.
Step 3: Average them
Add up the likes and divide by the number of posts. Do the same for comments.
Step 4: Divide by followers and multiply by 100
Engagement rate = (average likes + average comments) ÷ followers × 100
Step 5: Calculate the median too
Add likes and comments for each post to get its total interactions. Sort those totals from smallest to largest and take the middle value (or the average of the two middle values if you have an even number of posts). Divide that by followers and multiply by 100. This is your median engagement rate.
Worked example: why the median changes the answer
Here is an illustrative example: an account with 8,400 followers and 10 recent posts. Each number is likes plus comments for one post.
| Post | 1 | 2 | 3 | 4 | 5 | 6 | 7 | 8 | 9 | 10 |
|---|---|---|---|---|---|---|---|---|---|---|
| Interactions | 180 | 205 | 190 | 2,450 | 210 | 175 | 230 | 198 | 220 | 186 |
- Average: 4,244 total ÷ 10 posts = 424.4 interactions → 424.4 ÷ 8,400 × 100 = 5.05%
- Median: sorted, the middle two values are 198 and 205 → 201.5 → 201.5 ÷ 8,400 × 100 = 2.40%
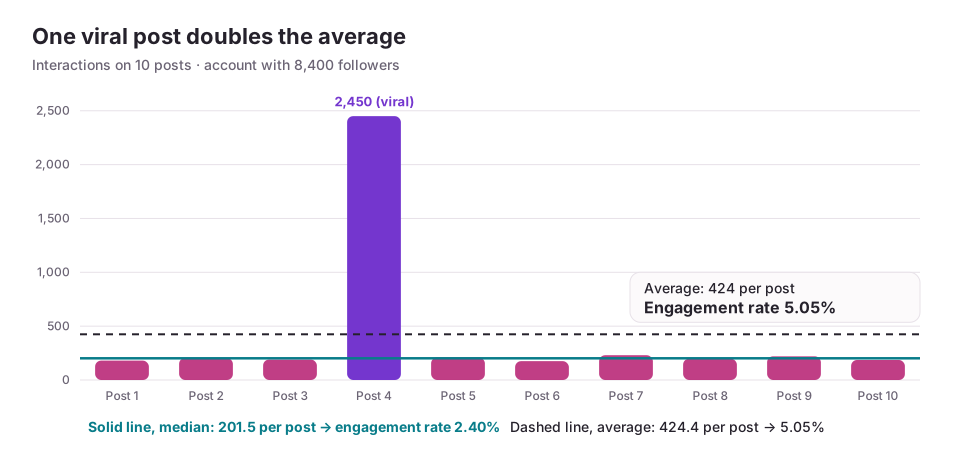
Post 4 went viral. The average says this account engages more than 5% of its followers. The median says a typical post reaches about 2.4%, which happens to sit right on the median for accounts with 1K to 10K followers in the benchmark table below. If you were a brand paying for one post, 2.4% is the number you should plan around.
A useful rule: if the average is more than 1.5 times the median, one or two posts are carrying the account. Report both numbers.
Copy-paste spreadsheet (Google Sheets or Excel)
Set up a sheet like this, with one row per post:
| Column | A | B | C | D |
|---|---|---|---|---|
| Header (row 1) | Post date | Likes | Comments | Interactions |
| Rows 2 to 13 | Date | Like count | Comment count | =B2+C2 (fill down) |
Put the follower count in cell F1, then add these formulas:
Average engagement rate:  =(AVERAGE(B2:B13)+AVERAGE(C2:C13))/F1*100
Median engagement rate:   =MEDIAN(D2:D13)/F1*100
Skew check (avg/median):  =AVERAGE(D2:D13)/MEDIAN(D2:D13)
Comments per 100 likes:   =SUM(C2:C13)/SUM(B2:B13)*100
The skew check flags accounts where the average is misleading. Comments per 100 likes is a quick quality signal: comments take more effort than likes, so a healthy ratio usually means a real audience rather than passive scrollers.
Which method should you use? A decision tree
- You are checking your own account and want precision → use Instagram Insights and engagement rate by reach. In the app, go to Profile > Professional dashboard > Account insights, then open the interactions view (Instagram renames these labels between app versions). For a single post, open it and tap View insights.
- You are comparing yourself to competitors or peers → use engagement rate by followers, because it is the only version you can calculate for their accounts. Compare against accounts in the same follower tier.
- You are vetting a creator for a paid partnership → use the median engagement rate by followers, plus comments per 100 likes. Ask the creator for a screenshot of their reach-based numbers as a second check.
- You need to check dozens of accounts → use a calculator tool (below) rather than a spreadsheet.
How to know which branch you are on: if you can open Instagram Insights for the account, you are the owner and can use reach. If you can't, you are limited to public, follower-based numbers.
Calculator tools that do it for you
All of these calculate engagement by followers from public data. They differ in which posts they sample and whether they show the median.
| Tool | Free option | Shows median | Post sample | Best for |
|---|---|---|---|---|
| Manual spreadsheet | Yes | Yes, with the formula above | You choose | Full control and learning the method |
| Instapect | Free profile summary, no login | Yes, next to the average | Recent feed posts, pinned excluded | Average and median together with a tier percentile and the formula shown |
| HypeAuditor | Free calculator | Not stated on the free tool | Recent posts | Influencer vetting, with audience-quality reports on paid plans |
| The Social Cat | Free calculator | Yes (uses median likes and comments) | Recent posts | A quick median-based check |
| Socialinsider | Free calculator | No | Posts from the last 30 days | Brands tracking competitors over time |
Two calculators will often give different numbers for the same account. That is expected: one may use 12 posts and another the last 30 days, and one may use the average while another uses the median. Pick one tool and stick with it when you track an account over time.
For a visual walkthrough of the manual method, Later's video tutorial covers the same formula step by step.
What is a good Instagram engagement rate? Benchmarks by follower tier
Engagement rate falls as follower count grows. Small accounts are mostly friends, family and early fans who interact with almost everything. Large accounts pick up passive followers who rarely interact. A single "good engagement rate" number ignores that, so compare within a tier.
Instapect benchmark data (October 2026)
The table below comes from public-profile audits run on Instapect between August 28 and October 7, 2026. Of 305 public reports, 140 met the quality bar: at least six recent posts sampled, visible like counts, and pinned posts excluded. Rates are engagement by followers.
| Follower tier | Accounts | Bottom quartile | Median | Top quartile | Typical median-post rate |
|---|---|---|---|---|---|
| Under 1K | 25 | 6.11% | 15.29% | 25.53% | 10.58% |
| 1K to 10K | 27 | 1.15% | 2.44% | 5.66% | 1.28% |
| 10K to 100K | 22 | 0.12% | 0.35% | 1.30% | 0.21% |
| 100K to 1M | 20 | 0.08% | 0.30% | 2.13% | 0.28% |
| 1M and above | 46 | 0.11% | 0.53% | 1.16% | 0.33% |
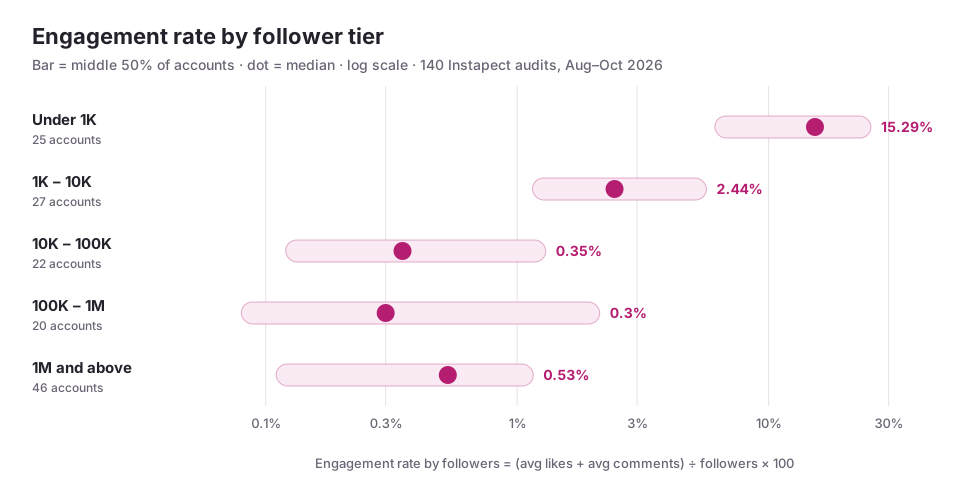
How to read it: if your account has 4,000 followers and an average engagement rate of 3%, you sit above the median for your tier (2.44%) but below the top quartile (5.66%). The last column shows the median rate calculated from each account's median post, which is lower in every tier because it strips out viral spikes.
Limits of this data. These 140 accounts are the profiles people chose to audit, so the set leans toward celebrities, media brands and small creators checking their own numbers. Sample sizes per tier are small (20 to 46 accounts), and each account is measured on its most recent posts only. Treat the tiers as directional and pair them with the large-sample figures below. The 10K to 100K tier coming in lower than the 1M+ tier is likely a quirk of which accounts were audited (several news and brand accounts sit in that band) rather than a rule.
Large-sample industry benchmarks
| Source | Sample | Metric | Figure |
|---|---|---|---|
| Socialinsider | 35M posts, 447,613 pages, 2025 | Average ER by followers | 0.48% (down about 24% year on year) |
| Socialinsider, Q2 2026 update | Same panel | Average ER by followers | 0.45% |
| Socialinsider, by format (2025) | Same panel | Carousels / Reels / images | 0.55% / 0.52% / 0.37% |
| Rival IQ via Sprout Social | Brand accounts across industries | Median ER per post | 0.36%; top 25% of brands reach 1.05% |
| Hootsuite | Posts across industries | Carousel ER, all industries | 4.2% (denominator not stated, so not directly comparable to the rows above) |
Across the 140 Instapect audits, 48% of accounts landed under 1%, 19% between 1% and 3%, 11% between 3% and 6%, and 22% at 6% or higher. The overall median was 1.18%.
How to check your result is right
Run these checks in order, easiest first:
- Sanity range. For any account above 10K followers, a rate above 10% is rare. If you see it, recheck the follower count you typed and confirm you divided averages, not totals. A rate above 100% always means you divided total interactions across all posts by followers.
- Skew check. Divide the average engagement rate by the median. Under 1.25 means a steady account. Between 1.25 and 1.5 is normal. Above 1.5 means one or two posts dominate, so quote the median.
- Cross-check with a tool. Run the same handle through one calculator. If your number is within about 20% of the tool's, your method is sound. Larger gaps usually come from a different post window or the median versus average choice.
- Owner check (your own account only). Compare your follower-based rate with your reach-based rate in Instagram Insights. Reach-based figures normally come out several times higher, so if they are close together, check whether most of your reach comes from followers rather than new audiences.
Common mistakes
| Mistake | What it does to the number | Fix |
|---|---|---|
| Including pinned posts | Inflates it, often a lot | Skip the pinned row at the top of the grid |
| Counting posts from the last day or two | Deflates it | Wait 48 hours before a post counts |
| Using total interactions instead of averages | Can push the rate above 100% | Average per post first, then divide by followers |
| Comparing a follower-based rate to a reach-based benchmark | Makes a healthy account look weak | Match denominators before comparing |
| Comparing a 2K account to a 2M account | Small accounts always look better | Compare within the same follower tier |
| Reporting only the average | Hides viral distortion | Always show the median next to it |
| Counting accounts with hidden likes as zero | Drags benchmarks down | Exclude them instead |
Who doesn't need to track this
If you post for friends and family, engagement rate is not worth tracking. It matters when someone makes a decision based on it: a brand choosing which creator to pay, a creator setting rates, or a marketer deciding whether a content format is working.
Keeping your numbers current
Engagement rate drifts. Recalculate monthly on the same posting window (last 12 posts) so the numbers stay comparable, and recalculate after any change in format mix, because Socialinsider's 2025 data shows carousels and Reels running ahead of single images. Note the date of each calculation; a rate is only meaningful with its sample window attached.
Frequently asked questions
What is the formula for Instagram engagement rate?
The standard public formula is (average likes + average comments) ÷ followers × 100, calculated over your last 9 to 12 feed posts. Account owners can also divide interactions by reach in Instagram Insights, which gives a higher number that should only be compared with other reach-based figures.
What is a good engagement rate on Instagram in 2026?
It depends on follower count. For brand accounts, 1% or higher puts you in roughly the top quarter, according to Rival IQ data cited by Sprout Social. In the Instapect audits, median rates were about 15% under 1K followers, 2.4% for 1K to 10K, and under 1% above 10K.
Is a 2.5% engagement rate good?
For an account between 1K and 10K followers, 2.5% is right around the median in the Instapect data. For an account above 10K followers, 2.5% is strong, well above the platform average of 0.45% to 0.48% reported by Socialinsider.
My engagement rate is over 100%. What went wrong?
You almost certainly divided the total interactions across all your posts by your follower count. Divide by the number of posts first to get the average per post, then divide by followers and multiply by 100.
Why do two engagement rate calculators show different numbers for the same account?
They sample different posts (for example, the last 12 posts versus the last 30 days) and some use the median instead of the average. Some also include saves and shares when the account owner connects Insights. Pick one tool and use it consistently.
The calculator says likes are hidden. Can I still calculate engagement rate?
Not with a public formula. When an account hides like counts, only the owner can see total interactions in Instagram Insights. Comment counts alone undercount engagement badly, so exclude the account from comparisons rather than estimating.
My engagement rate dropped after I passed 10K followers. Is something broken?
Probably not. Engagement rate falls as audiences grow because new followers interact less than early ones. In the Instapect data the median drops from 2.44% for 1K to 10K accounts to 0.35% for 10K to 100K. Compare yourself with your new tier.
Should I include saves and shares?
Include them if you are the account owner and calculating from Instagram Insights, because they are strong signals of value. Leave them out when comparing public accounts, because saves are never public and share counts are not shown consistently, so the comparison would be uneven.
Do Reels and carousels count the same as photo posts?
Yes, all feed posts go into the same calculation. Format does change results, though: Socialinsider measured average follower-based rates of 0.55% for carousels, 0.52% for Reels and 0.37% for single images in 2025.
How often should I recalculate my engagement rate?
Once a month is enough for most accounts. Use the same window each time (your last 12 feed posts) so changes reflect your content, not a change in method.
Your next step
Pick one account, yours or a competitor's, and work through it this week: record the last 12 posts in the spreadsheet above, calculate both the average and the median, and place the result in the follower-tier table. If the skew check comes back above 1.5, plan around the median.
If you want to skip the spreadsheet, run a free Instapect audit on any public handle. It shows the average and median side by side, the tier percentile, and the formula behind every number.