Instagram engagement rate is (average likes + average comments) ÷ followers × 100, measured over an account's recent feed posts. The calculator above does that for any public profile in about ten seconds, then adds the number most free calculators leave out: the median engagement rate. It matters more than it sounds. In 140 public-profile audits run on Instapect between August 28 and October 7, 2026, the average was at least 1.5 times the median on 44% of accounts, which means one or two posts were doing most of the work.
Disclosure: Instapect publishes this page and makes the calculator on it. Every check below can also be done by hand or with the other free calculators listed further down.
What the Instagram engagement rate calculator measures
| Output | Formula | Why it is there |
|---|---|---|
| Engagement rate (average) | (average likes + average comments) ÷ followers × 100 | The standard public formula, comparable with most published benchmarks |
| Median engagement rate | Median of each post's (likes + comments) ÷ followers × 100 | Shows what a typical post earns, so one viral post cannot inflate the result |
| Tier standing | Your rate against the 25th, 50th and 90th percentile anchors for your follower tier | A 3% rate means something different at 2,000 followers than at 2 million |
| Comments per 100 likes | Average comments ÷ average likes × 100 | A rough read on whether people talk or just tap |
| Sample line | Posts used, date range, pinned posts excluded, hidden likes | So you can judge the number before you trust it |
The sample is the account's 12 most recent feed items. Pinned posts are removed, because they sit at the top of the grid for months and keep collecting likes. Posts with hidden like counts stay in for comment and cadence figures but are left out of like-based maths, and the report says how many were affected.
The free profile summary works without an account. The full breakdown with the median, tier standing and per-post table comes with the detailed report, which needs a free registration (two detailed scans included). Reports already in the public directory can be read free.
How to check Instagram engagement rate against your follower tier
Engagement rate falls as an account grows. Early followers are friends and fans who react to almost everything; later followers scroll past more often. That is why the calculator never compares a 3,000-follower account with a celebrity. It grades each account against anchors for its own tier:
| Follower tier | Bottom quartile (p25) | Typical (p50) | Top decile (p90) |
|---|---|---|---|
| Under 1K | 6.0% | 12.0% | 25.0% |
| 1K to 5K | 2.0% | 4.0% | 8.0% |
| 5K to 25K | 1.4% | 2.8% | 6.0% |
| 25K to 100K | 0.9% | 1.8% | 3.8% |
| 100K to 500K | 0.5% | 1.0% | 2.2% |
| 500K to 1M | 0.35% | 0.7% | 1.6% |
| 1M and above | 0.15% | 0.35% | 0.9% |
These are the anchors in Instapect's scoring model as of October 2026. The under-1K row was recalibrated from Instapect's own audits, where accounts that small had a median rate near 15%. Changes to any anchor are logged on the scoring changelog.
Reading it takes three checks:
- Find your row. Below p25 means fewer interactions than three in four peers. Between p25 and p50 is below typical. Above p50 is better than most. At p90 or higher, engagement is a strength, not a problem.
- Compare the average with the median. If the average is under 1.25 times the median, the account is steady and either number is fair to quote. Above 1.5 times, quote the median.
- Check comments per 100 likes. Roughly 1 to 3 is healthy for most accounts. Far below that usually means passive scrolling; far above can mean giveaways or comment pods.
For large-sample context, Socialinsider's 2026 benchmarks put the platform-wide average at 0.48% by followers (35M posts from 447,613 pages, January to December 2025) and 0.45% in Q2 2026. For observed tier medians from Instapect audits, see the engagement rate guide.
Worked example: @kingjames
Here is a real public report: @kingjames, retrieved September 5, 2026. The account had 153,934,402 followers, and the sample was 12 posts from August 25 to September 5 with no pinned posts and no hidden likes.
| Step | Value |
|---|---|
| Average likes per post | 381,439 |
| Average comments per post | 2,760 |
| Engagement rate (average) | (381,439 + 2,760) ÷ 153,934,402 × 100 = 0.25% |
| Median post (likes + comments) | 175,904 |
| Median engagement rate | 175,904 ÷ 153,934,402 × 100 = 0.11% |
| Average ÷ median | 2.2 times |
| Comments per 100 likes | 0.72 |
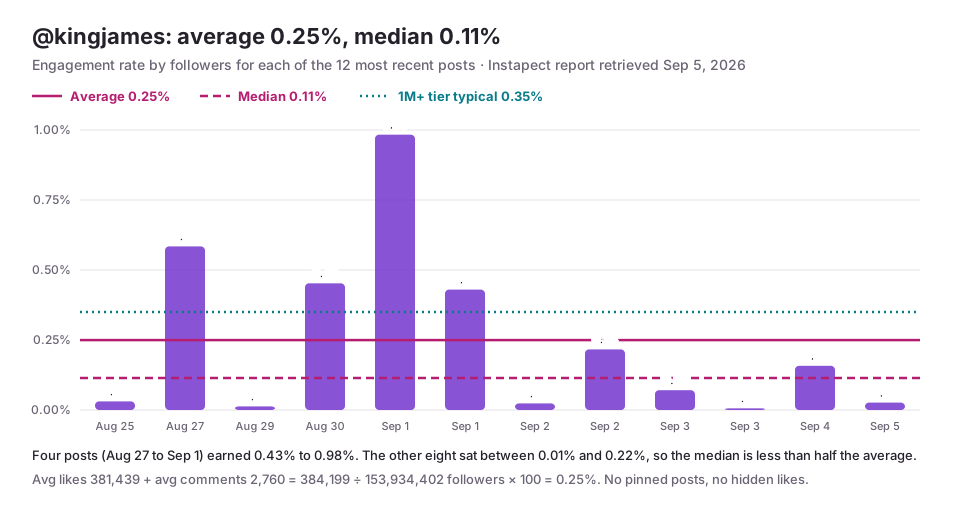
Against the 1M+ anchors, the average of 0.25% sits between the bottom quartile (0.15%) and typical (0.35%). The median of 0.11% sits below the bottom quartile. Four posts between August 27 and September 1 earned 0.43% to 0.98% each; the other eight earned 0.01% to 0.22%. A brand planning one sponsored post here should plan around the median, not the average. These figures describe that 12-post window only, and the live report may show newer numbers after a refresh.
How often the average misleads (Instapect data)
Of the 305 public reports in the Instapect directory, 140 met the quality bar: at least six recent posts with visible like counts, pinned posts excluded, audited between August 28 and October 7, 2026. For each one, the average engagement rate was divided by the median.
| Average ÷ median | Accounts | Share | What to quote |
|---|---|---|---|
| Under 1.25 times | 47 | 34% | Either number |
| 1.25 to 1.5 times | 31 | 22% | Either, with the median noted |
| 1.5 to 2 times | 30 | 21% | The median |
| 2 times or more | 32 | 23% | The median, and look at which posts carried it |
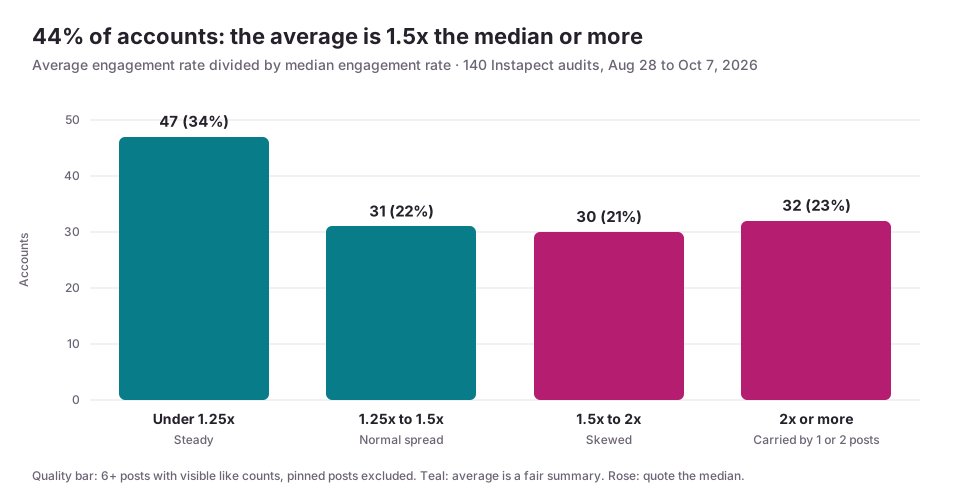
Across all 140, the middle account's average ran 1.44 times its median. Limits: these are the accounts people chose to audit, which leans toward celebrities, media brands and small creators checking themselves. Each is measured on its latest posts only. Read it as a reason to always ask for both numbers, not as a platform-wide rate.
What this calculator cannot measure
Instapect only reads what any visitor can see on a public profile: posts, visible like and comment counts, captions, hashtags, mentions, posting times and follower count. It does not show:
- Reach, impressions, views-based rates or saves. Only the account owner sees these in Instagram Insights (Profile > Professional dashboard > Account insights).
- Story views or audience demographics. Also owner-only.
- Private accounts. Nothing can be calculated without public posts.
- Fake followers. A low rate can hint at inactive followers, but the calculator does not detect or label bots.
- Accounts that hide likes on every post. Like-based rates are unavailable; comment figures still show.
If you own the account, a reach-based rate from Insights is the more precise number for your own planning. The follower-based rate is the one you can compare across accounts you don't own.
Other free Instagram engagement rate calculators compared
Each tool below is free to try and calculates from public data. They give different numbers for the same account because they sample different posts and use different formulas, so pick one and stick with it when tracking over time. Details checked October 9, 2026.
| Tool | Formula | Average or median | Posts sampled | Honest strength |
|---|---|---|---|---|
| Instapect (this page) | (Likes + comments) ÷ followers | Both, side by side | 12 most recent, pinned excluded | Shows the skew and tier standing, with the formula on every number |
| HypeAuditor | (Likes + comments) ÷ views when there are enough recent Reels, otherwise ÷ followers | Median | 30 latest pieces of content | Median plus a views-based rate, which suits Reels-heavy creators |
| The Social Cat | Median (likes + comments) per post ÷ followers | Median | Recent posts (count not stated) | Clear High to Low bands for six follower tiers from 1K to 1M |
| Socialinsider | (Likes + comments) ÷ posts in the last 30 days ÷ followers | Average | Last 30 days | Built on the same method as its 35M-post benchmark report; business accounts only |
| Spreadsheet | Any of the above | Your choice | Your choice | Full control; the step-by-step guide has copy-paste formulas |
Benchmarks differ between tools too. HypeAuditor's calculator page lists an average of 1.2% for accounts above 1 million followers, while Instapect's 1M+ typical anchor is 0.35%. HypeAuditor divides by views when an account posts enough Reels, and views are usually far fewer than followers, which pushes the rate up. Match the method before comparing.
Frequently asked questions
How do I check the engagement rate of any Instagram account?
Type the public handle into the box at the top of this page. It takes the 12 most recent feed posts, removes pinned ones, and returns engagement rate by followers with the median beside it. To do it by hand, average the likes and comments of the last 9 to 12 posts, add them, divide by followers and multiply by 100.
What is a good engagement rate on Instagram?
It depends on follower count. In Instapect's scoring model the typical rate is 4.0% for 1K to 5K followers, 1.0% for 100K to 500K and 0.35% above 1 million. Across all accounts, Socialinsider measured a 0.48% average in 2025.
Why is the median lower than the average?
Because a few posts earned far more than the rest. The average counts every like on a viral post; the median takes the middle post. In 140 Instapect audits, 44% of accounts had an average at least 1.5 times the median.
Is this Instagram engagement rate calculator free?
Yes. The profile summary needs no account. The detailed report with median, tier standing and post table needs a free registration, which includes two detailed scans. Public reports in the directory are free to read.
My engagement rate is over 100%. What went wrong?
If you calculated it yourself, you probably divided total interactions across all posts by followers. Divide by the number of posts first. The calculator here always averages per post, so it cannot produce that error.
The calculator says likes are hidden. What does that mean?
The account owner turned off like counts on some or all posts, an option Instagram has offered since 2021 (per Meta). Those posts are excluded from like-based maths. If every post hides likes, no follower-based rate can be calculated from public data.
Why does HypeAuditor show a different number for the same account?
HypeAuditor samples the 30 latest pieces of content, uses the median, and divides by views instead of followers when there are enough recent Reels. Instapect uses 12 posts and followers. Different window and different denominator give different results.
My rate dropped after a viral post. Is something wrong?
Usually not. A viral post can bring in followers who interact less afterwards, so the denominator grows faster than likes. Check the median over the next few weeks; if it holds steady, the drop is the new follower count, not weaker content.
Can it tell me if an account has fake followers?
No. A rate far below the tier's bottom quartile, combined with very few comments per 100 likes, is worth a closer look, but it is not proof. Instapect does not run fake-follower detection.
How often should I recheck engagement rate?
Monthly is enough for most accounts. Use the same tool and the same post window each time, and note the date: a rate only means something next to the posts it was measured on.