@mrfarhadr.fx profile picture

@mrfarhadr.fx

@mrfarhadr.fx · Financial service

387
Followers
148
Following
Not published
Posts
81Instapect ScoreA−

Instapect Score

81/100 · grade A− — a performance read, benchmarked against under 5K followers.

Nano tier387 followersAudience Reach17/100Benchmarked against under 5K followers
Engagement rate
28.40%

by followers · typical 4.00%

Avg likes
101

median 89

Avg comments
9

median 0

Cadence
0.4

posts / week · 17.5 d apart

Comment-to-like
8.83%

healthy band 1–3%

Median ER
24.81%

middle post in the sample

Public-profile audit · 12 posts sampled · retrieved 9 Sept 2026· served from cache

Forex Trader Liquidity & Risk Management Precision • Patience • Discipline 📊 تحلیل روزانه بازارهای مالی 👇 آموزش‌های رایگان در تلگرام

t.me/LiquidityTrader23

Profile snapshot

Headline public metrics for @mrfarhadr.fx, from 12 sampled posts. Averages sit beside medians so one viral post cannot flatter the picture.

Engagement rate

28.40%

(avg likes + avg comments) ÷ followers · median 24.81% · under 5K followers

Average likes

101

Median 89 · 5 posts with a visible like count

Average comments

9

Median 0 · comment-to-like 8.8%

Posting cadence

0.4posts / week

About one post every 17.5 days

Latest posts

Newest first · engagement rate by followers per post

7 Sept 2026 · reel

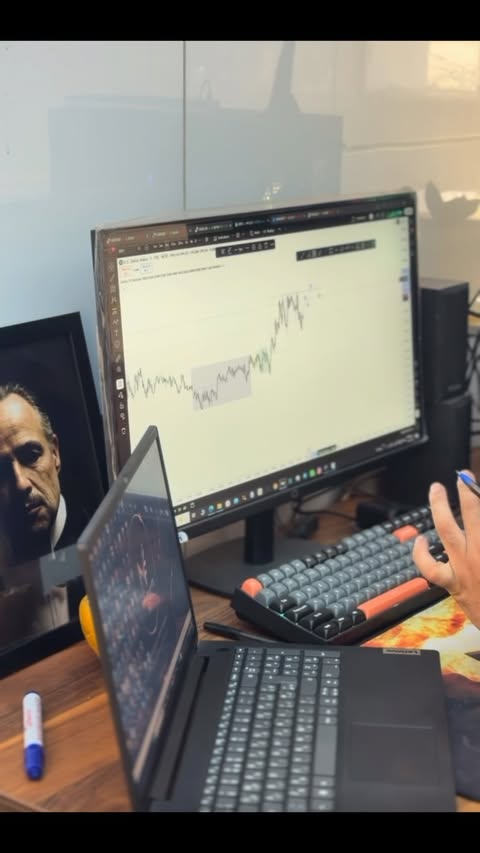
۹۰٪ کسانی که وارد معامله‌گری می‌شن، اصلاً دنبال «یادگیری» نیستن؛ دنبال هیجان، سیگنال و توهمِ پولدار شدن هستن. فکر می‌کنن با کشیدن چند خط روی چارت و حفظ کردن چند تا اصطلاح انگلیسی، اسمشون شده «تریدر». نه... معامله‌گری با چند خط روی چارت شروع نمی‌شه؛ با شناخت خودت شروع می‌شه. سال‌ها تمرین، صدها اشتباه، ضرر، انضباط، مدیریت ریسک و کنترل ذهن... چارت ساده‌ترین قسمت ماجراست؛ سخت‌ترین معامله، معامله با خودته. #فارکس #trader #روانشناسی

20

likes

0

comments

5.17%

ER

27 Aug 2026 · reel

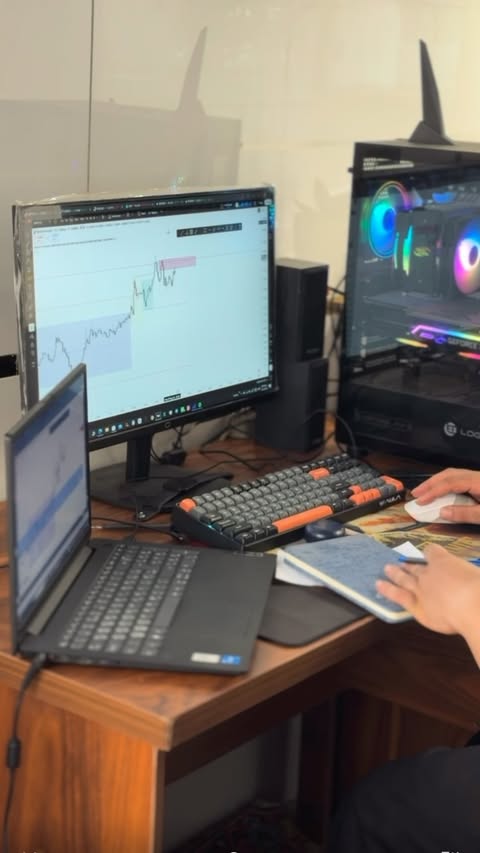
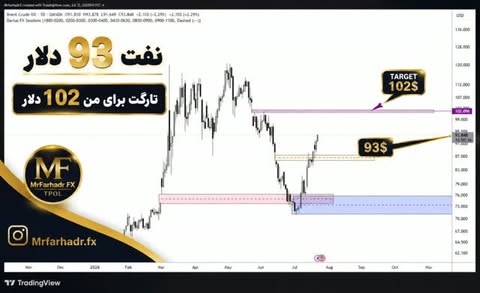
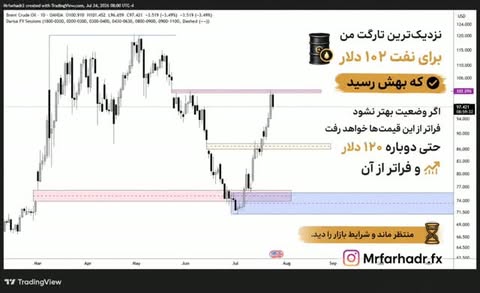
ارتباط بین تکنیکال ، نقدینگی ، زمان برای مشاهده ی اموزش های کامل و بیشتر حتما عضو کانال تلگرام شوید .. لینک کانال تلگرام بیو هستش ❤️ . . . . . . . #فارکس #forex #ارزدیجیتال #trader #traderlifestyle

181

likes

33

comments

55.30%

ER

25 Aug 2026 · reel

اولین پست اموزشی سایت forex factory اگر دنبال اموزش درباره ترید هستی پیج منو فالو کن❤️🙏 #forex #فارکس

195

likes

56

comments

64.86%

ER

19 Aug 2026 · reel

trading ❤️✅ . . . . . #forex #فارکس #ارزدیجیتال #trader #

89

likes

7

comments

24.81%

ER

16 Aug 2026 · carousel

📚 بعضی کتاب‌ها فقط برای خواندن نیستند؛ برای تغییر طرز فکر و نگاه ما به زندگی هستند. اگر اهل یادگیری و رشد هستید، این کتاب را از دست ندهید. ذخیره‌اش کنید؛ شاید روزی به کارتان بیاید. 📖 #کتاب #روانشناسی #روانشناسی_ترید #تریدر #فارکس

Hidden

likes

0

comments

ER

7 Aug 2026 · carousel

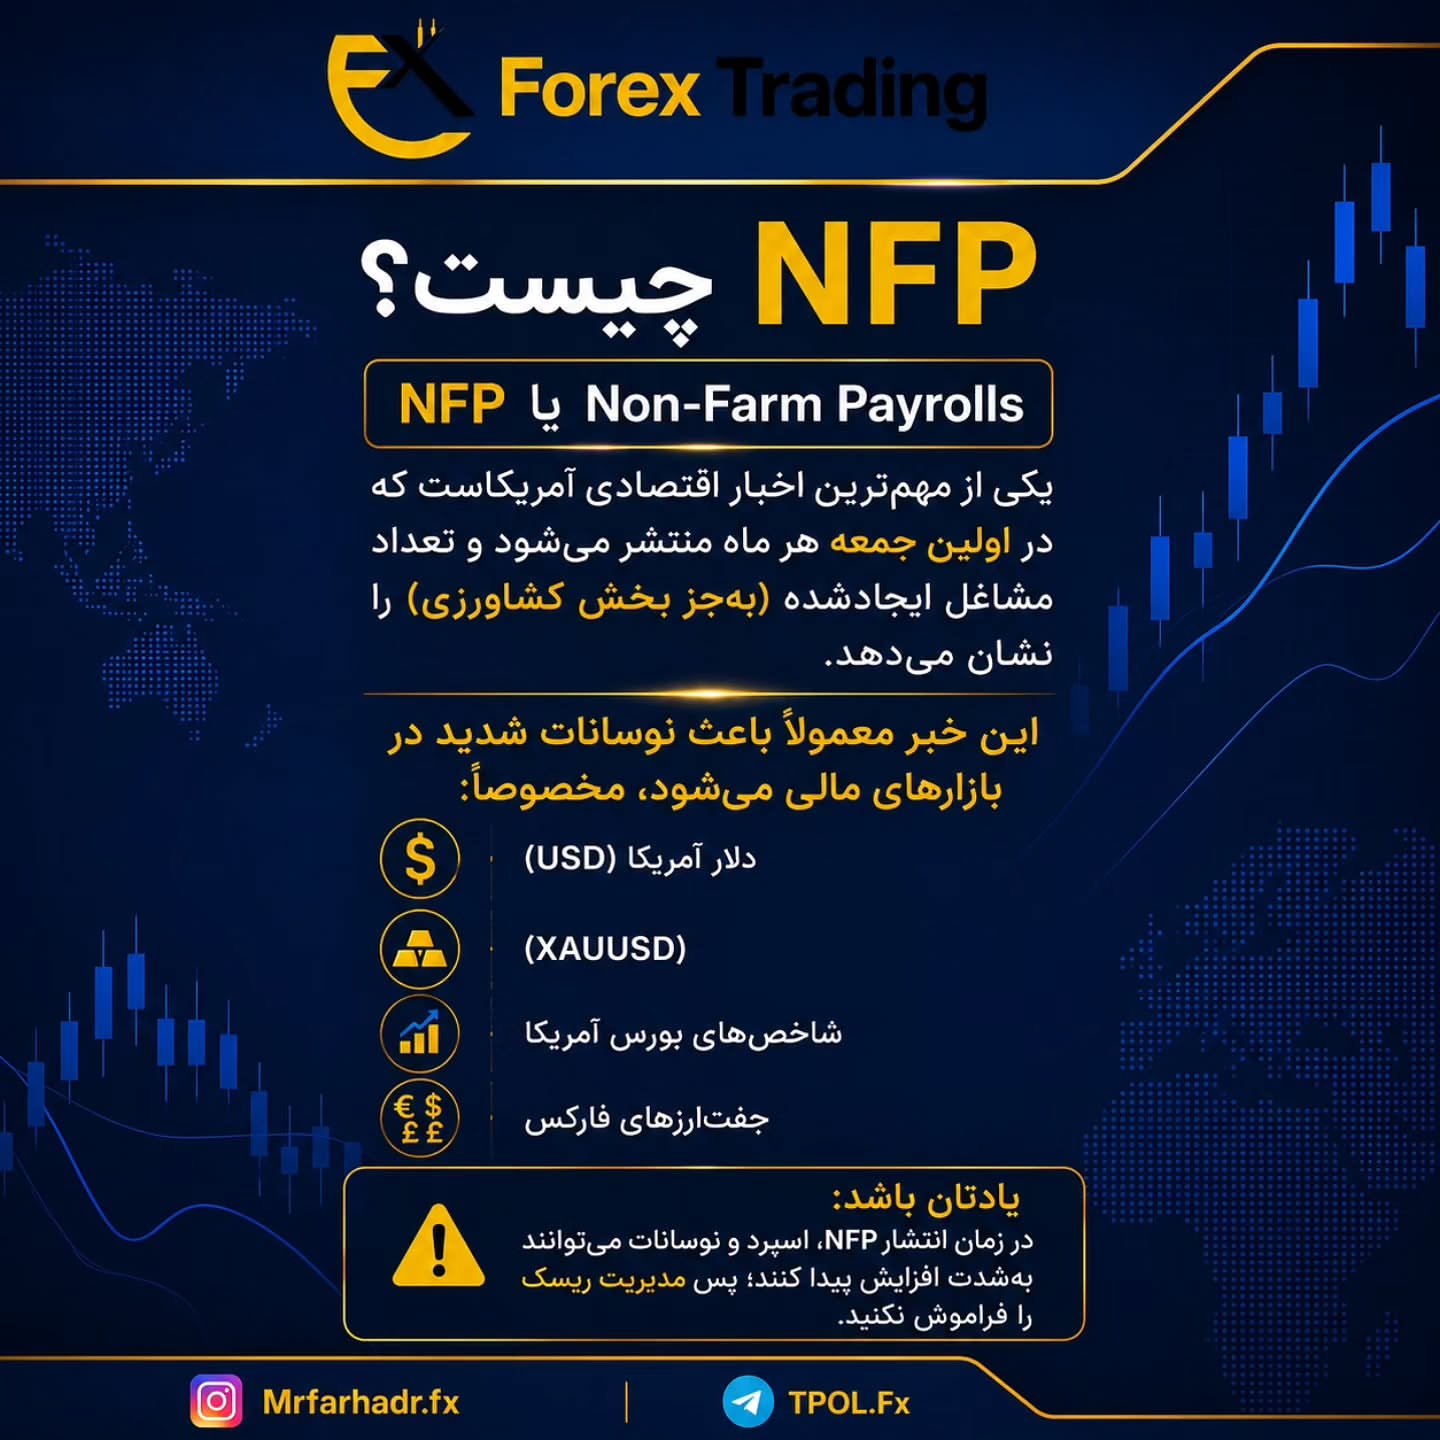
NFP اشتغال بخش غیر کشاورزی #خبر #اخبار #فارکس #تریدر #مدیریت_ریسک

Hidden

likes

0

comments

ER

How the score was built

The verdict is at the top of the page; this is the reasoning underneath it. Every sub-score prints its own weight and formula — no black box.

Archetype

High-Engagement Community

Both the rate of response and the depth of it are strong — this audience reacts and talks back.

Nominal weights: Engagement 35% · Engagement Quality 25% · Consistency 15% · Content Performance 15% · Growth 10%. Audience Reach is context only and carries no weight — every account is graded against peers in its own follower tier · composite from 4 of 5 signals — unavailable sub-scores are excluded from both sums, not scored zero

Audience Reach

17 /100

Nano tier

387 followers (under 10K followers). An asset score: how many people this account can reach. It does not move with how well the posts perform.

What this means

Engagement is top-decile for this size

Engagement rate 28.40% is at or above the 8.00% top-decile mark for under 5K followers. Audience responsiveness is the strength of this account, not something it needs to fix.

Posting frequency is the most controllable lever

At 0.40 posts per week — one every 18 days — the account publishes less than once a week. Unlike engagement rate, cadence is entirely within the owner's control, which makes it the cheapest thing on this page to change.

Audience Reach

17 /100

387 followers puts this account in the Nano tier (under 10K followers). This is an asset score — how many people the account can reach — and it never moves based on how well the posts perform.

Weight 0% · log-scaled followers: L = log10(followers); L≤3 → 5–25, 3<L≤6 → 25 + (L − 3) × 20, L>6 → 85 + (L − 6) × 15, capped 100

log10(387) = 2.59, mapped as 25 + (L − 3) × 20 across the 1K–1M range (1K=25, 10K=45, 100K=65, 1M=85, 10M=100).

Engagement

100 /100

Engagement rate 28.40%, at or above the 8.00% top-decile rate for accounts with under 5K followers. Typical is 4.00%.

Weight 35% · piecewise-linear percentile curve for under 5K followers: 0%→5, p25 2.00%→30, p50 4.00%→55, p90 8.00%→85, 14.40%→100

Engagement rate 28.40% mapped onto the under 5K followers percentile curve (0%→5, p25 2.00%→30, p50 4.00%→55, p90 8.00%→85), measured across 5 of 12 sampled posts with visible like counts.

Engagement Quality

100 /100

8.83 comments per 100 likes, above the 1–3% healthy band, an unusually conversational audience. A comment costs far more effort than a like, so this ratio measures conversation rather than reach.

Weight 25% · comment-to-like ratio = avg comments ÷ avg likes × 100, mapped 0%→5, 0.5%→30, 1.5%→65, 3%→90, ≥5%→100

8.83 comments per 100 likes mapped as 0%→5, 0.5%→30, 1.5%→65, 3%→90, ≥5%→100.

Consistency

5 /100

Posting cadence 0.40 posts per week, below the 1-per-week floor most active accounts clear. Gaps between posts vary by 1.89× the mean gap of 17.5 days — under 0.5× reads as a dependable rhythm.

Weight 15% · 60 × (1 − clamp(stdev(gaps) ÷ mean(gaps), 0, 1)) + 40 × cadence factor (0/wk → 0, 3/wk → 1.0, 3–7/wk → 1.0, 14/wk → 0.6, ≥21/wk → 0.3)

regularity 0.00 (1 − stdev 33.2d ÷ mean gap 17.5d) and cadence factor 0.13 from 0.4 posts/week (0→0, ramping to 1.0 at 3/wk, flat 1.0 through 7/wk, tapering to 0.6 at 14/wk and 0.3 at 21+/wk).

Content Performance

78 /100

The best post in the window drew 2.2× the median post's likes — 1× means no post ever breaks out, 3× or more means the account reliably produces outliers worth repeating. 100% of sampled posts carry both a caption and at least one hashtag (a well-kept feed is usually above 80%), across 3 distinct formats.

Weight 15% · 60 × upside score (top-post likes ÷ median likes: 1×→30, 2×→60, 3×→80, ≥5×→100) + 25 × caption-and-hashtag share + 15 × format mix (1.0 if ≥2 product types, else 0.5)

upside 2.19× (top post 195 likes ÷ median 89) scoring 64, enrichment 1.00 (caption + ≥1 hashtag), format mix 1.0 (3 distinct product types).

Growth Signals

Not measurable

Weight 10% · clamp(50 + weekly follower growth % × 25, 0, 100), where weekly % = (followers now ÷ followers then − 1) × 100 ÷ weeks

This is the first recorded audit of this account, so there is no observation window yet. Instagram publishes no follower history — Instapect measures growth by comparing snapshots it takes itself, and the trend appears from the second audit that is at least 7 days later.

Growth & cadence

Instagram publishes no follower history, so Instapect builds its own: every audit records a snapshot, and the trend below is measured across those snapshots. Everything else here comes from the visible posting record.

Follower growth

This is the first recorded audit of this account, so there is no observation window yet. Instagram publishes no follower history — Instapect measures growth by comparing snapshots it takes itself, and the trend appears from the second audit that is at least 7 days later.

Engagement rate per post (%)

Oldest to newest across the sampled posts. Unit: % of followers.

Likes and comments per post

Unit: absolute interactions per post.

Free account required

Create a free account to see when this account posts and when its audience actually responds — weekday mix and hour-of-day heatmap.

Engagement diagnostics

Averages are easily distorted by one viral post. The median tells you what a typical post actually does — read them side by side.

Average engagement rate

28.40%

Mean of (likes + comments) ÷ followers

Comment-only engagement rate

2.30%

Comments ÷ followers × 100 — the honest fallback when likes are hidden

Median engagement rate

24.81%

Middle post in the sample

Comment-to-like ratio

8.8%

Higher means more conversational audience

Like-based sample

5of 12 posts

7 posts hide their like count and are excluded from like-based numbers only — they still count for cadence, format, captions and comments (12 posts).

Free account required

Create a free account to see the full engagement distribution — how far the best and worst posts sit from the median.

Content leaderboard

Posts ranked by engagement rate by followers. Pinned posts are shown because a reader will recognise them, but they sit outside the measured window and feed no average, rate or rhythm.

Free account required

Create a free account to see the full content breakdown — every top post with its thumbnail and per-post engagement rate.

Hashtags & mentions

Frequency from captions in the sample, with the average engagement rate of the posts each tag appears on. Association, not causation.

Free account required

Create a free account to see the full hashtag and mention detail, with the engagement associated with each tag.

Action plan

Prioritised by expected impact, written from the measured data above. The advisor sees only the metrics this report could actually compute — never an estimate, never a metric Instagram keeps private.

Free account required

Create a free account to read the full AI action plan, the content plan, post ideas, hashtag strategy and best time to post for this account.

Methodology & caveats

What this report measures, how, and what it deliberately does not claim.

What this account does not make measurable

  • 7 of 12 sampled posts hide their like count. They stay in the sample for cadence, format, caption and comment metrics, and are excluded only from like-based ones, which are computed from 5 posts.
  • The content sample is the 12-item recent-posts window. The reels endpoint reaches further back and covers Reels only, so it is used to enrich matched items with their play count (8 matched) — never to extend the sample, which would inflate the Reel share and corrupt cadence.
  • 4 older Reels outside the content window are shown separately in "Top Reels by plays" with their own window, and are excluded from every average, the format mix and all cadence maths.
  • Play counts are published public counts shown only where the provider returns them. They are not reach, views or watch time, and none of those are available for a public-profile audit.

KPI definitions

  • Engagement rate by followers = (average likes + average comments) ÷ followers × 100.
  • Median engagement rate = the middle post's engagement rate in the sample; robust to viral outliers.
  • Posting cadence = (sampled posts − 1) ÷ days spanned × 7. Intervals, not posts: n posts span n−1 gaps. Unavailable below 2 posts or a zero-day window.
  • Instapect Score = 0.35 × Engagement + 0.25 × Engagement Quality + 0.15 × Consistency + 0.15 × Content Performance + 0.10 × Growth Signals, renormalised over the sub-scores that could be measured. Every account is graded against peers in its own follower tier; Audience Reach is reported separately and carries no weight.
  • Comment-to-like ratio = average comments ÷ average likes × 100. A healthy conversational account sits between 1% and 3%.

Sample, source & limits

  • 12 public posts sampled (5 usable for like-based metrics) · retrieved 9 Sept 2026 · served from the 24-hour cache.
  • Only lawfully-visible public signals are used: published posts, visible counts, captions, hashtags, mentions and timestamps.
  • Instapect never reports reach, impressions, audience demographics, Story insights or Reels watch-time. Those are private to the account owner and any tool claiming them for a third party is guessing.
  • Benchmarks are published industry medians by follower tier and are indicative, not guarantees. Any forward-looking figure is labelled an estimate with its method stated.

Share this score

A ready-to-post card with the Instapect Score, grade and the headline public metrics. Free to download — no account needed.

No card generated for this profile yet.

Cards show only lawfully-visible public metrics and carry the sample size and retrieval date, so anyone who sees one can check the full report.

This report is built only from lawfully-visible public Instagram signals — published posts and visible counts. It contains no reach, impressions, demographics, Story insights or watch-time, because nobody outside the account can see those. Request removal and the report is delisted from the directory, the category hubs and the sitemap.